Marketing measurement · method & checks · optional
How I tested whether campaign reports counted late-arriving conversions.
Four checks test the timing rule, the way credit is assigned, the risk of testing many campaigns at once, and week-by-week stability.
This page asks a narrower question: does the finding survive a different timing rule, a different way of assigning credit, a many-comparisons check, and separate weekly tests? The plan written before analysis, supporting charts, and source record live here.
Four checks, translated.
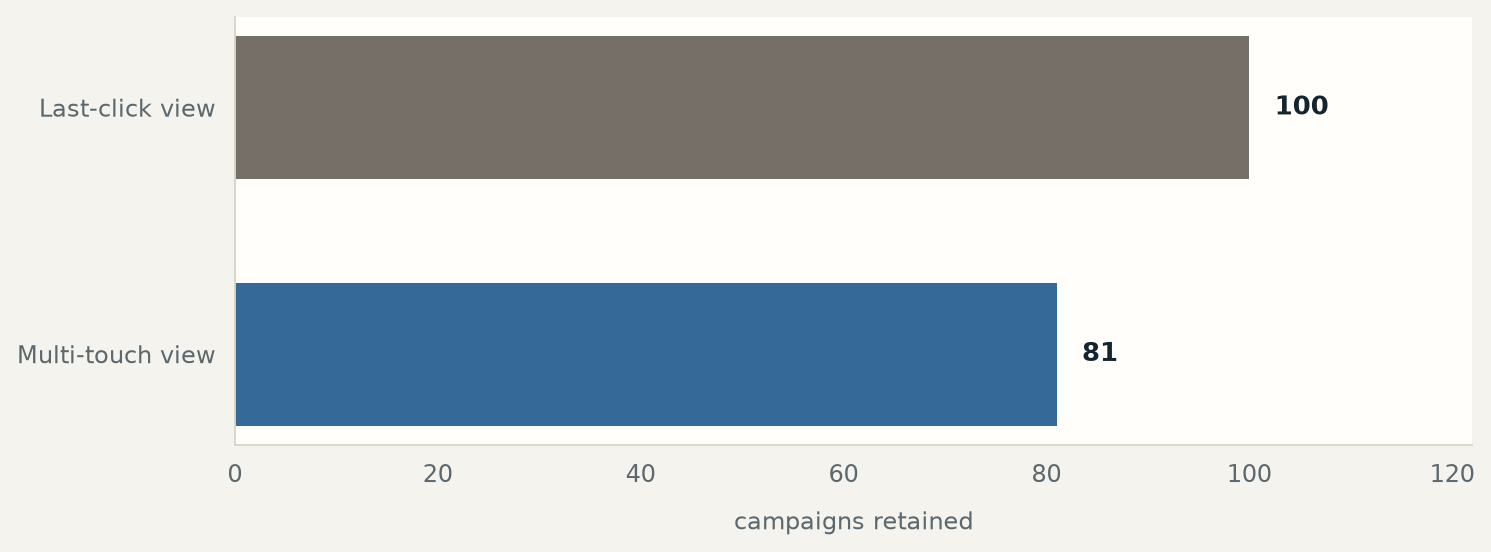
Last-click and multi-touch change the answer for some campaigns.
Two attribution models were run on the same corrected data: 100 rows scored last-click, 81 scored multi-touch. 45 campaigns flip verdict depending on the model, a real methodological choice, not a rounding difference.
The correction used 616 eligible campaigns, not all 675.
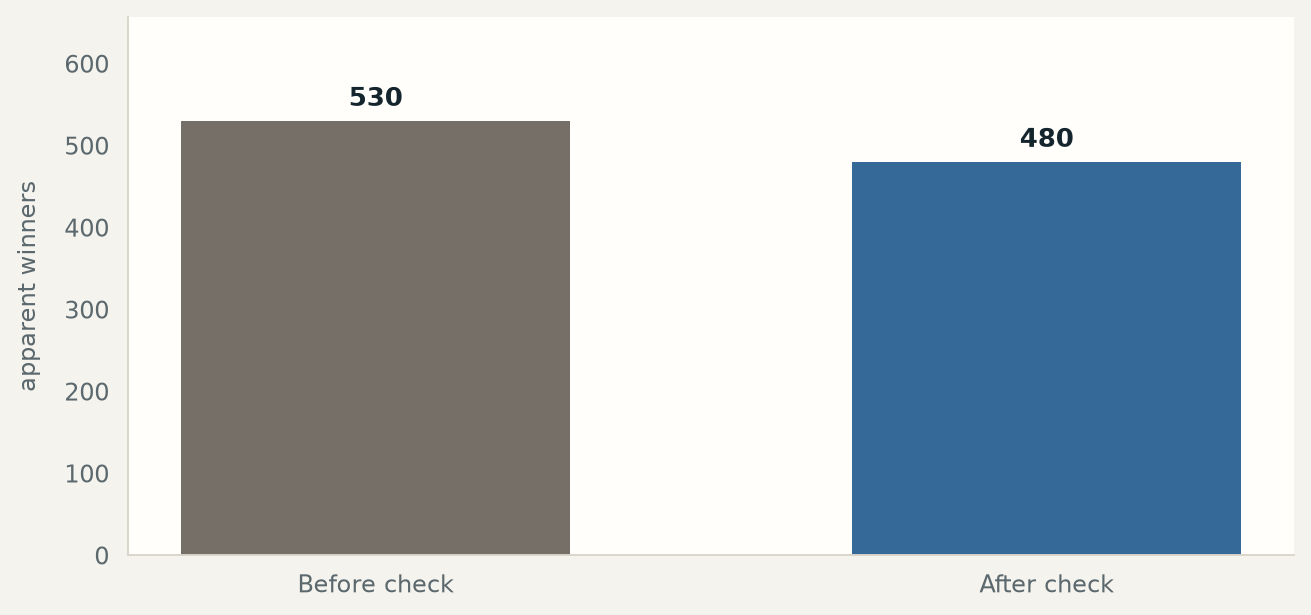
The benchmark contains 675 campaigns, but 59 fell below the held-out impression floor, leaving 616 eligible for this test family. The uncorrected screen had 530 apparent winners. At q = 0.1, Benjamini–Hochberg requires p < 0.002; 480 of the 616 clear that bar. That survival rate reflects the volume in each eligible campaign, not a loose correction.
A walk-forward check across weekly windows.
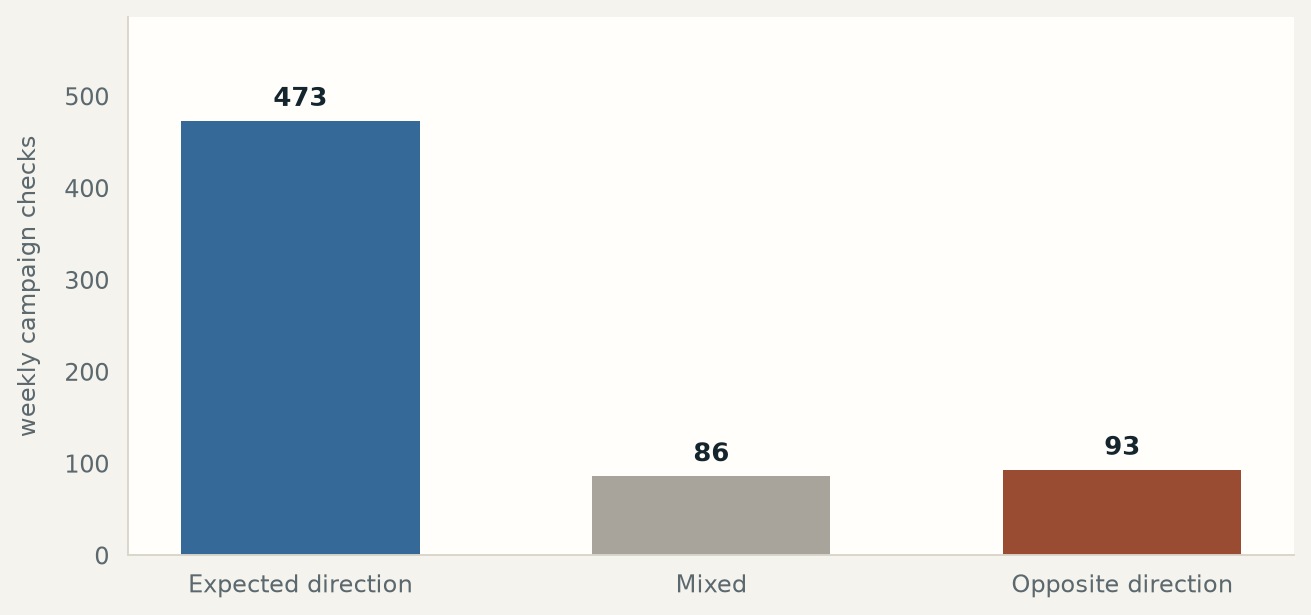
This is a separate check from the leakage screen above. Of the 652 campaigns with enough weekly volume, 93 stayed consistently above baseline, 473 stayed consistently at or below it, and 86 flipped sides. Read those first two numbers as one result, not opposing ones: 87% had a stable weekly signal, whichever side of baseline they landed on. Week-one agreement with the full-sample verdict was 88.4%, which is the honest result for a real dataset, not a perfect one.
The prediction written before analysis did not fully match what happened. The first eligible week agreed with the full-sample verdict 88.4% of the time. I kept that original weekly prediction in the record instead of rewriting it after seeing the result; the mismatch is part of the evidence, not an inconvenience to hide.
The campaigns that survive skew toward a specific profile.
Surviving campaigns run at 2.62× the impression volume, 1.27× the click-through rate, and 0.16× the cost per customer of the ones that do not survive. Their volume sits around the 77.3% percentile—higher than roughly three quarters of campaigns. The correction is not one-size-fits-all; it has a shape, and that shape is worth knowing before applying it elsewhere.
Five checks, read as a set rather than in isolation.
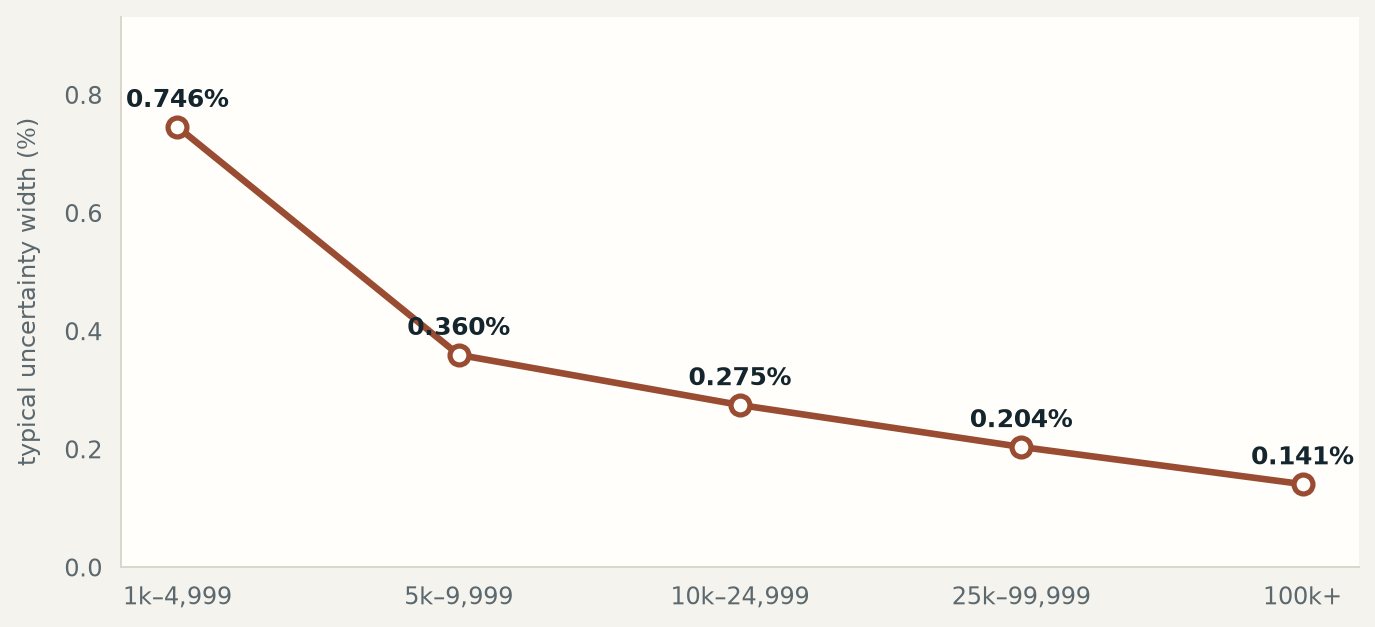
Each asks a different question: does the finding hold over time, weaken with thin data, depend on one attribution model, survive many comparisons, and match the timing mechanism?
A real, tested pipeline, not a one-off script.
The study runs as a 21-script pipeline against a public Criteo advertising dataset: seven ordered stages from capture through decision, then separate scripts for the placebo, weekly stability, and other documented checks, plus a test suite that must pass before a number is trusted. The source dataset, decision-run identifier, and schema-verification status are all in the receipt below. This is a public-benchmark study, so nothing here is redacted. The public page shows the checked summary; the raw working record remains private. The analysis plan was written before the placebo results were known. During the final clean rerun, a provenance-order concern was corrected and every later output was regenerated without rewriting that plan.
When claims matter, go deeper.
A plan written before analysis and a public benchmark are what it takes to trust a result. That standard travels to any measurement problem.